
A Simple Guide to...Inforgraphics
Jun 12, 2017
An infographic is a way of displaying information in a graphical format. It’s no secret that we as humans tend to learn and explain best when information is presented in a visual way. This has been happening for thousands and thousands of years – from cave paintings to Egyptian hieroglyphs or Chinese script. Although, the modern infographic strikes differences, the concept is still the same.
The modern day infographic is a combination of storytelling and data presentation. To create a simple but informative infographic there are a few key elements you need to think about, we’ve put together this simple guide to ensure you create the perfect infographic.
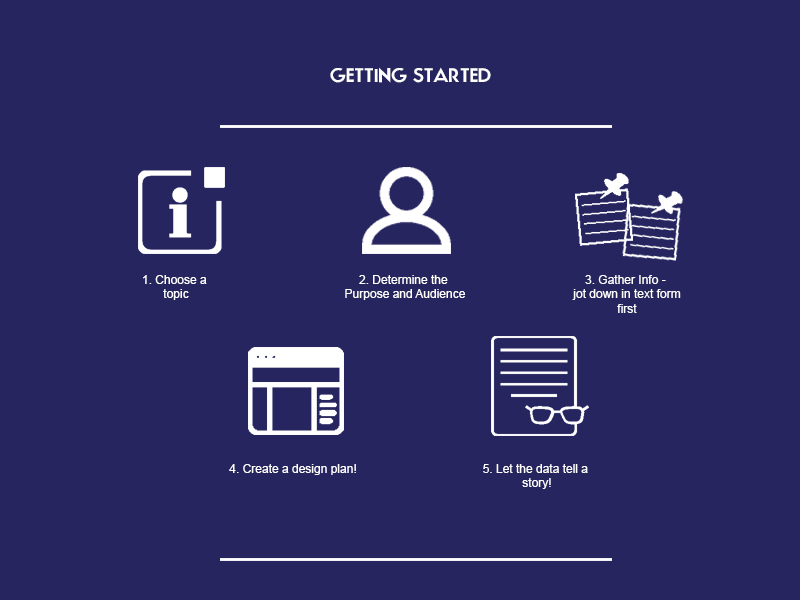
Getting Started
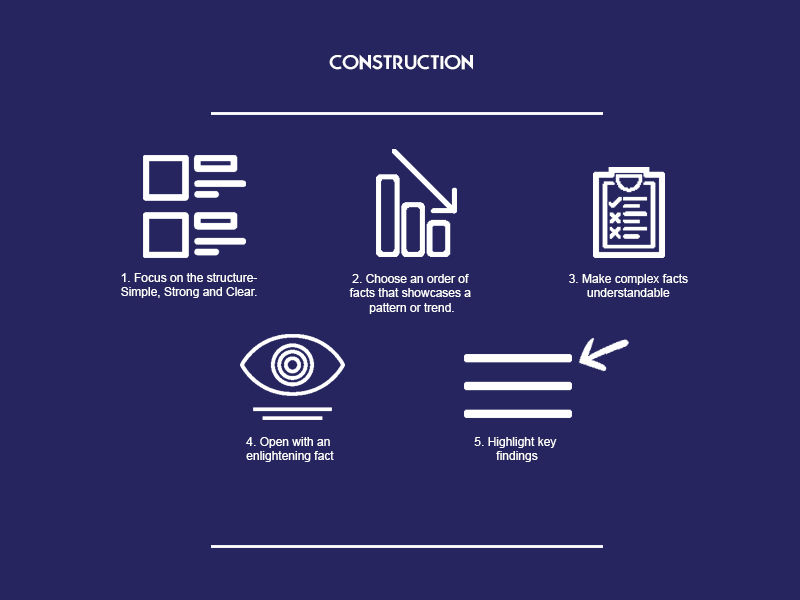
Construction
One of the most important things when creating an infographic is making sure it tells a story; it needs to have the reader gripped with interesting facts and lead to an overall meaning. Creating an engaging narrative is a priority when constructing. Bear in mind your audience- who are they? What beliefs do they hold about your topic? What do they already know? How easily could they be distracted from their environment? What style would suit them? In understanding your reader, the better chance you have of them sharing the content with fellow colleagues or even on their social media platforms.
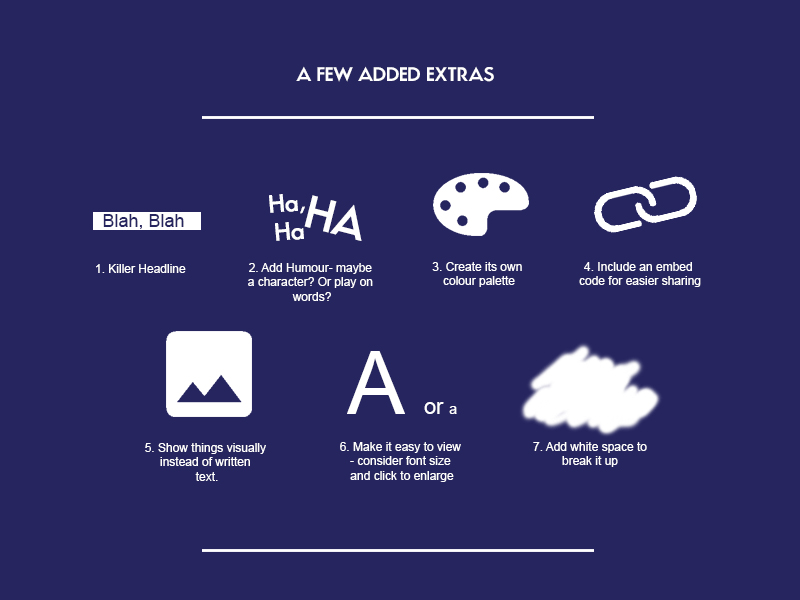
A few added extras
You need to capture attention, and a few written facts in a fancy layout won’t cut it! Everyone is making an infographic now, and you need to make yours stand out from the crowd in order to get noticed. Adding a few little extras and really making sure you pay attention when creating an infographic means you’re on your way!
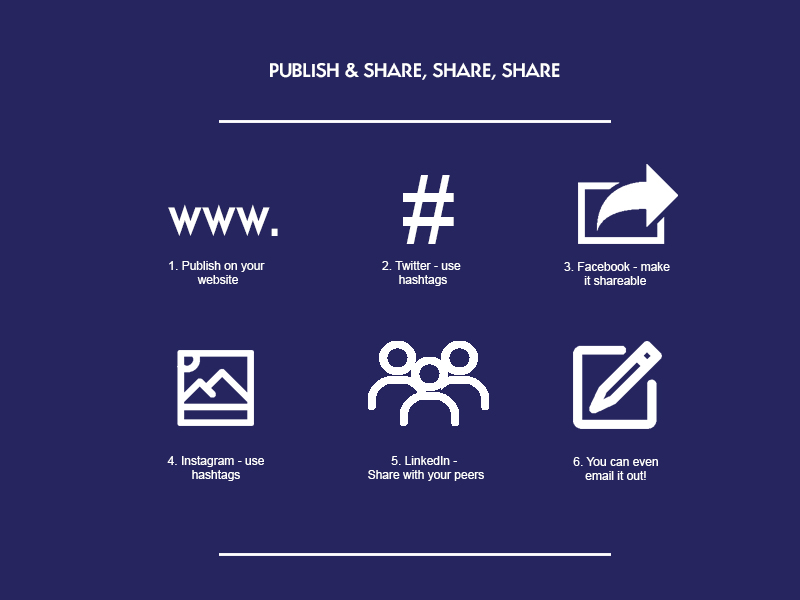
Publish & Share, Share, Share!
You’ve done it! You have created an infographic but, the hard work doesn’t stop there. There would be no point in spending the time to make one if no one got to see it! The best way to get it out there is to publish it on your social media platform. Twitter, Facebook and Instagram are the three biggest and are the most likely platforms to get the most engagement. Use hashtags to open up a global conversation on Twitter, reply to any comments and start debates to drum up engagement. LinkedIn is another place to publish your infographic with your peers. You can continue to share your infographic multiple times throughout the month if it doesn’t become out of date.
We’ve covered the basics; we hope this has helped you get started. Creating an infographic can take time to get it right so, have a play around- you really can’t make any mistakes. We’d love to see your infographics, drop us a direct message, @thecreationlab on any of our platforms and if you have any further questions, we’d be more than happy to help. We also have tonnes of free resources to get you started on everything digital!
Add Pingback